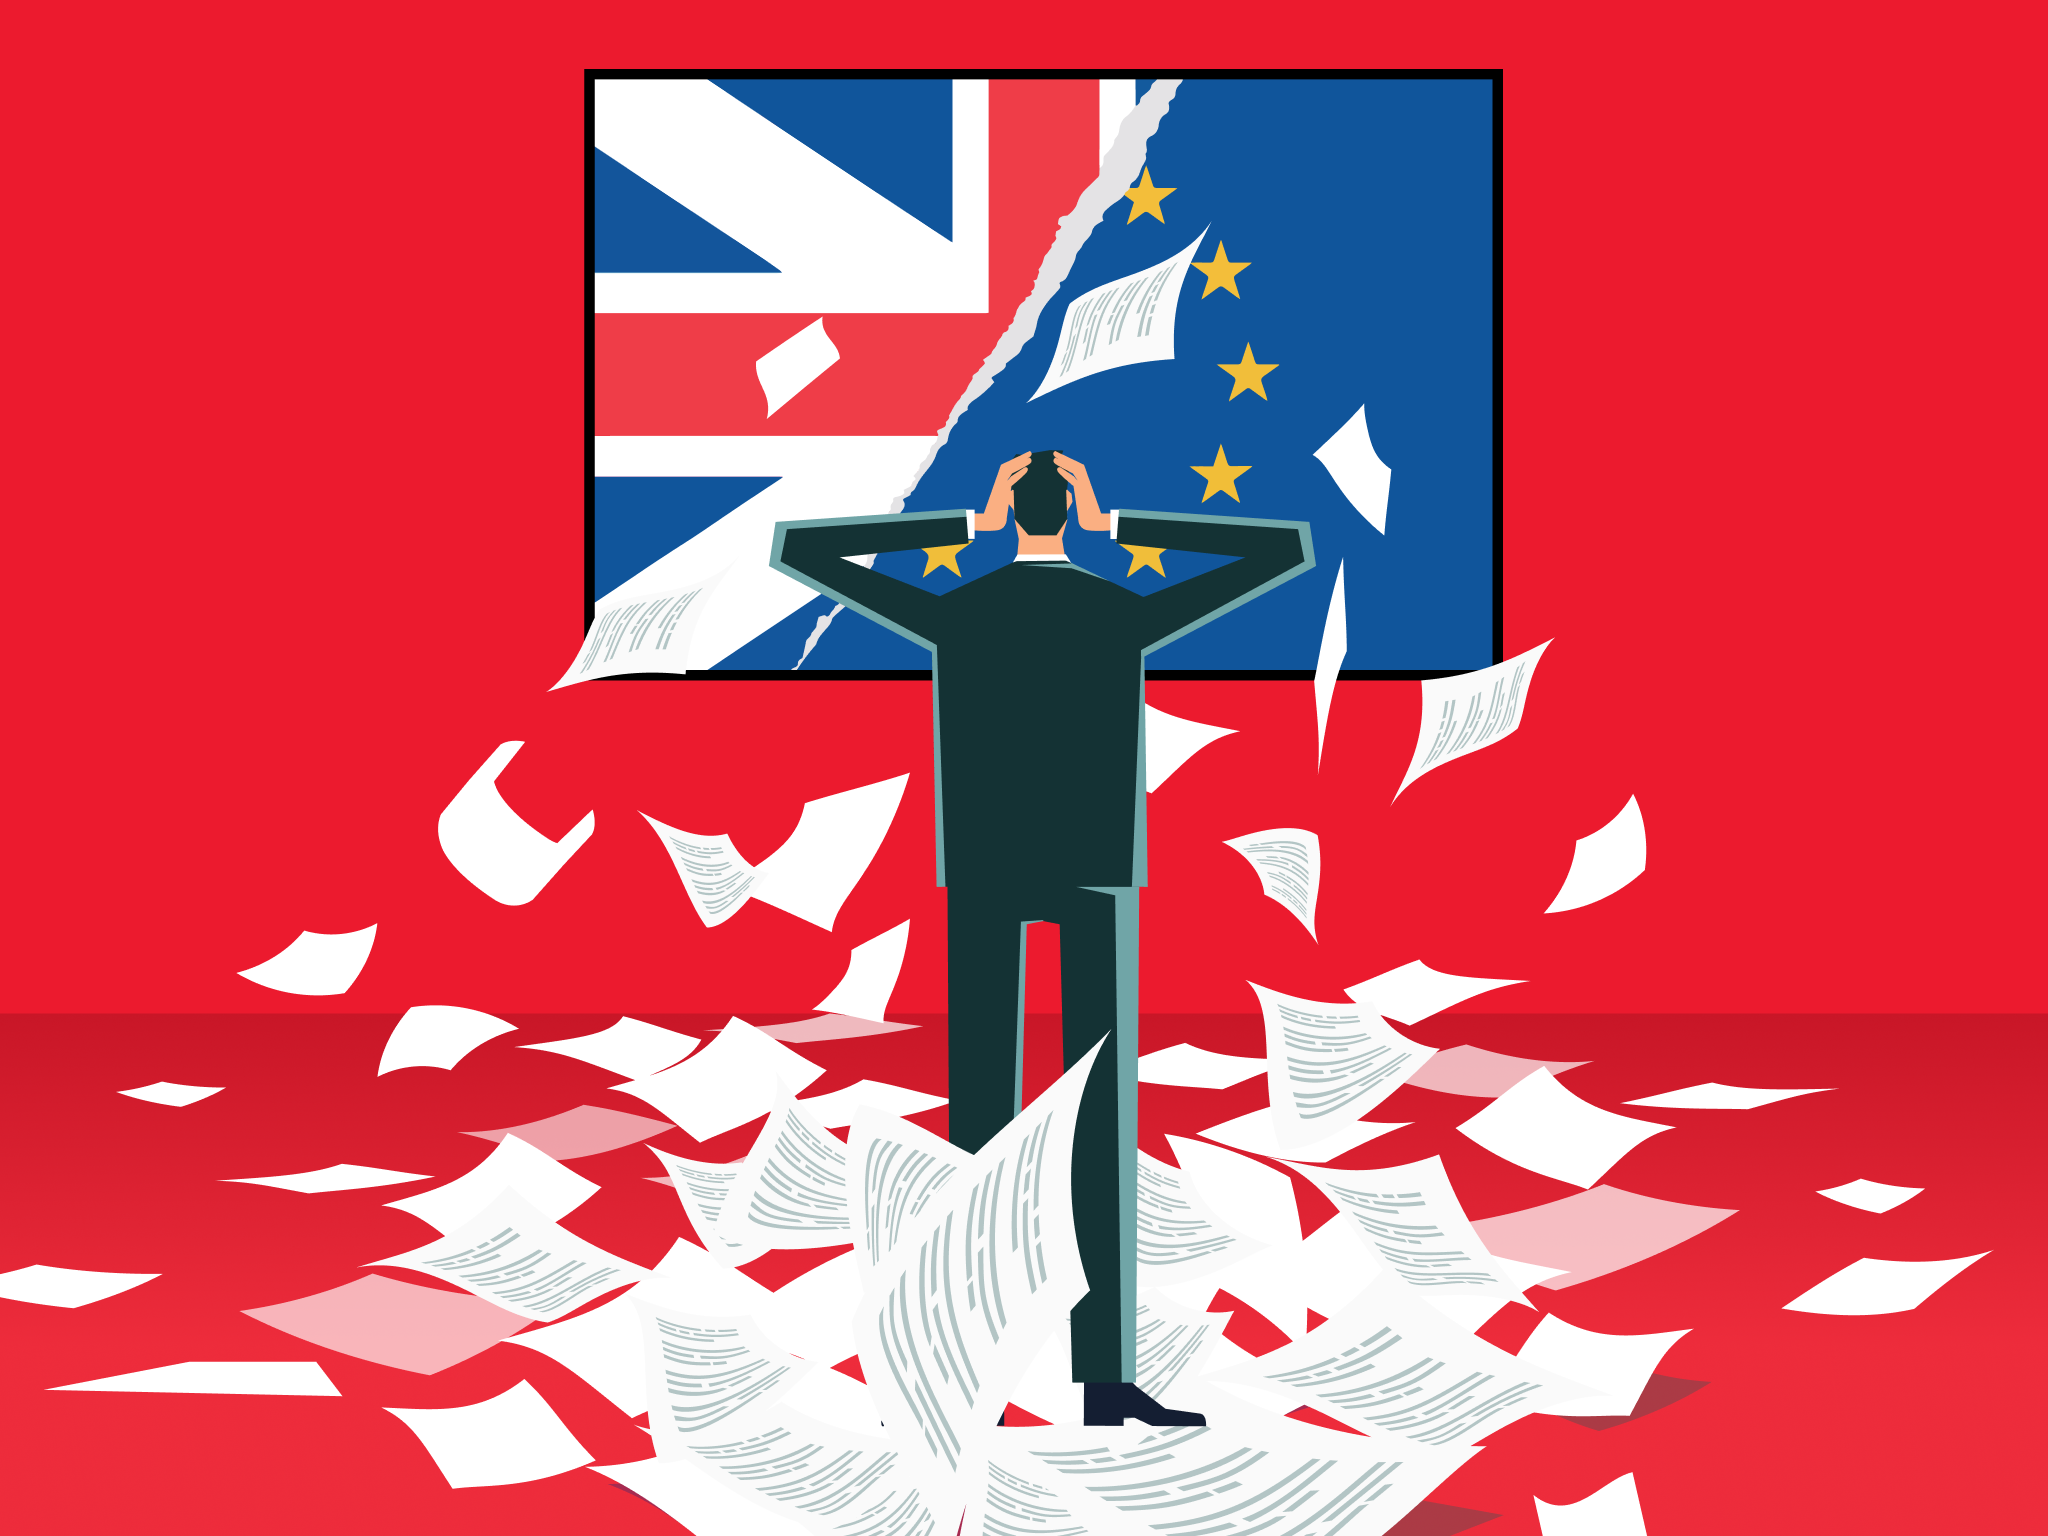
The damning statistics that reveal the true cost of Brexit, five years on
Share:
As January marks five years on from Britain leaving the EU, Alicja Hagopian and Kate Devlin explore its impact. It has been five years since Brexit “got done” – and voters and politicians alike are still counting the cost. Britons voted to leave the European Union by 52 per cent to 48 per cent in 2016, in a rare referendum that triggered the resignation of then-prime minister David Cameron. The United Kingdom then officially withdrew from the European Union on the 31 January 2020, followed by a transition period that lasted until January 2021.
![[In 2020, farmers from Save British Farming protested against post-Brexit rule changes which would lower food safety and animal welfare standards.]](https://static.independent.co.uk/s3fs-public/thumbnails/image/2020/07/08/17/pictures-of-the-day-4.jpg)
Brexiteers promised a new age of British sovereignty, a crackdown on migration and the much-derided “£350m a week” that could be diverted from the EU back into the NHS. But half a decade on, and by many metrics, Brexit appears to have missed the mark.

Since Britain left the EU, migration has been at the highest levels since records began; while key sectors face staffing shortages. And six in ten Britons (59 per cent) think that Brexit has gone fairly or very badly, with just 12 per cent believing it has gone well, according to a YouGov poll in October.
![[In 2016, the Vote Leave campaign drove a tour bus around the UK, with the words: ‘We send the EU £350 million a week. Let’s fund our NHS instead.’]](https://static.independent.co.uk/2021/03/10/15/GettyImages-576855022.jpg)
UK trade expert David Henig told The Independent: ”The UK now has significant trade barriers to its neighbours. It’s something we will have to live with. We will not be allowed to forget it; there will always be issues.”. Brexit-optimist economist Julian Jessop, a fellow at the Institute of Economic affairs, admitted that Brexit has made it harder or “impossible” for small businesses to adjust.


